Context
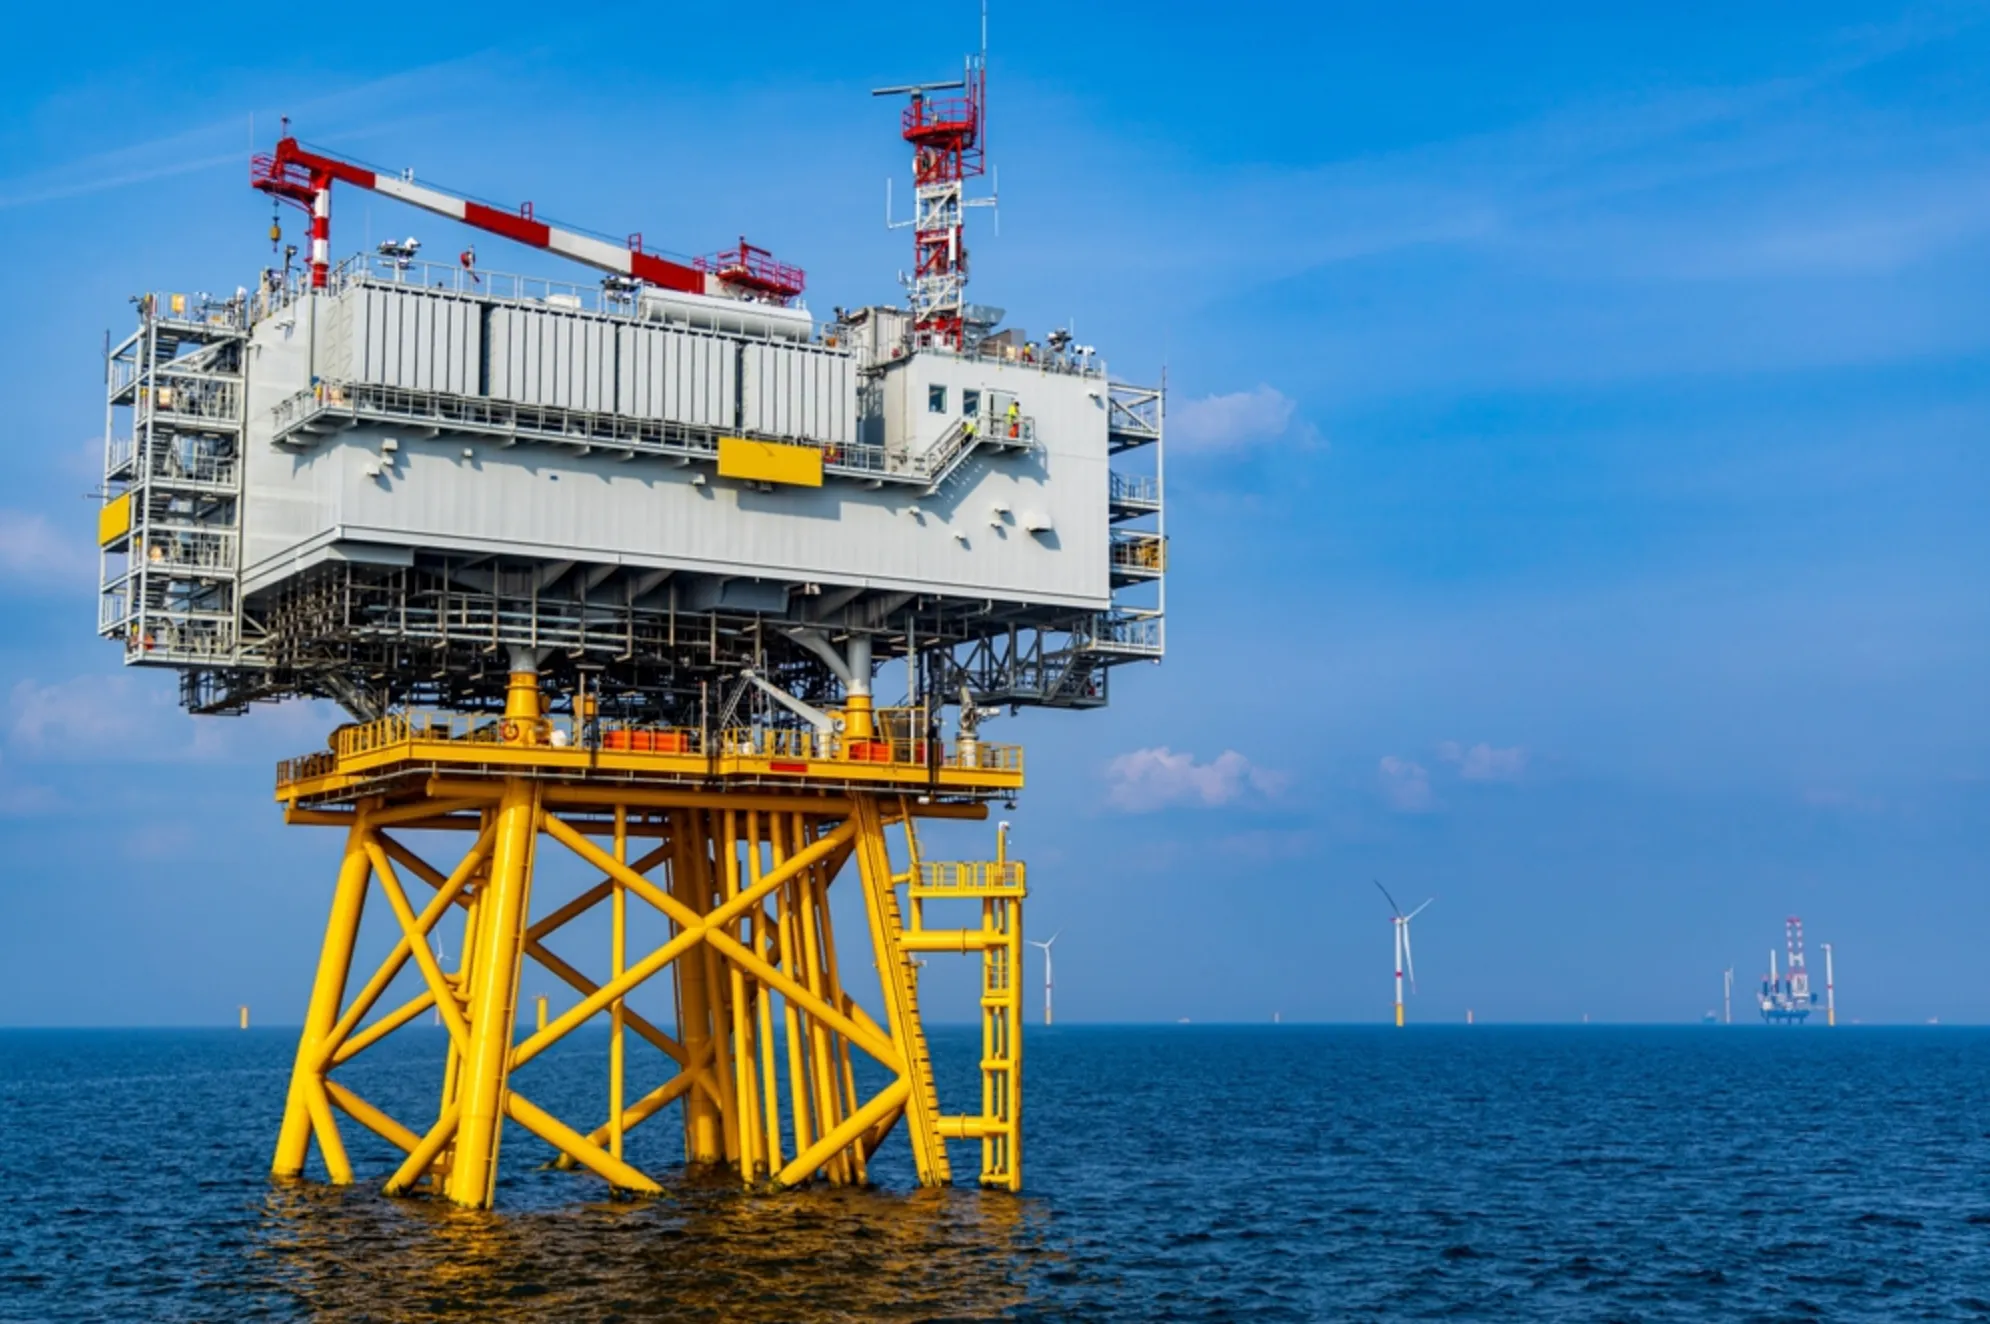
Spinergie’s supply chain analysis of a recently commissioned wind farm unpicked potential areas that could result in supply bottlenecks as pressure on the offshore fleet grows. Saint Nazaire, which lies off the northwest coast of France, consists of 80 turbines on monopile foundations in water depths between 13 and 28 metres. Now fully commissioned, the full timeline of the project, from the beginning of construction in May 2021, to the commercial operation date (COD) in September 2022, was 16 months.
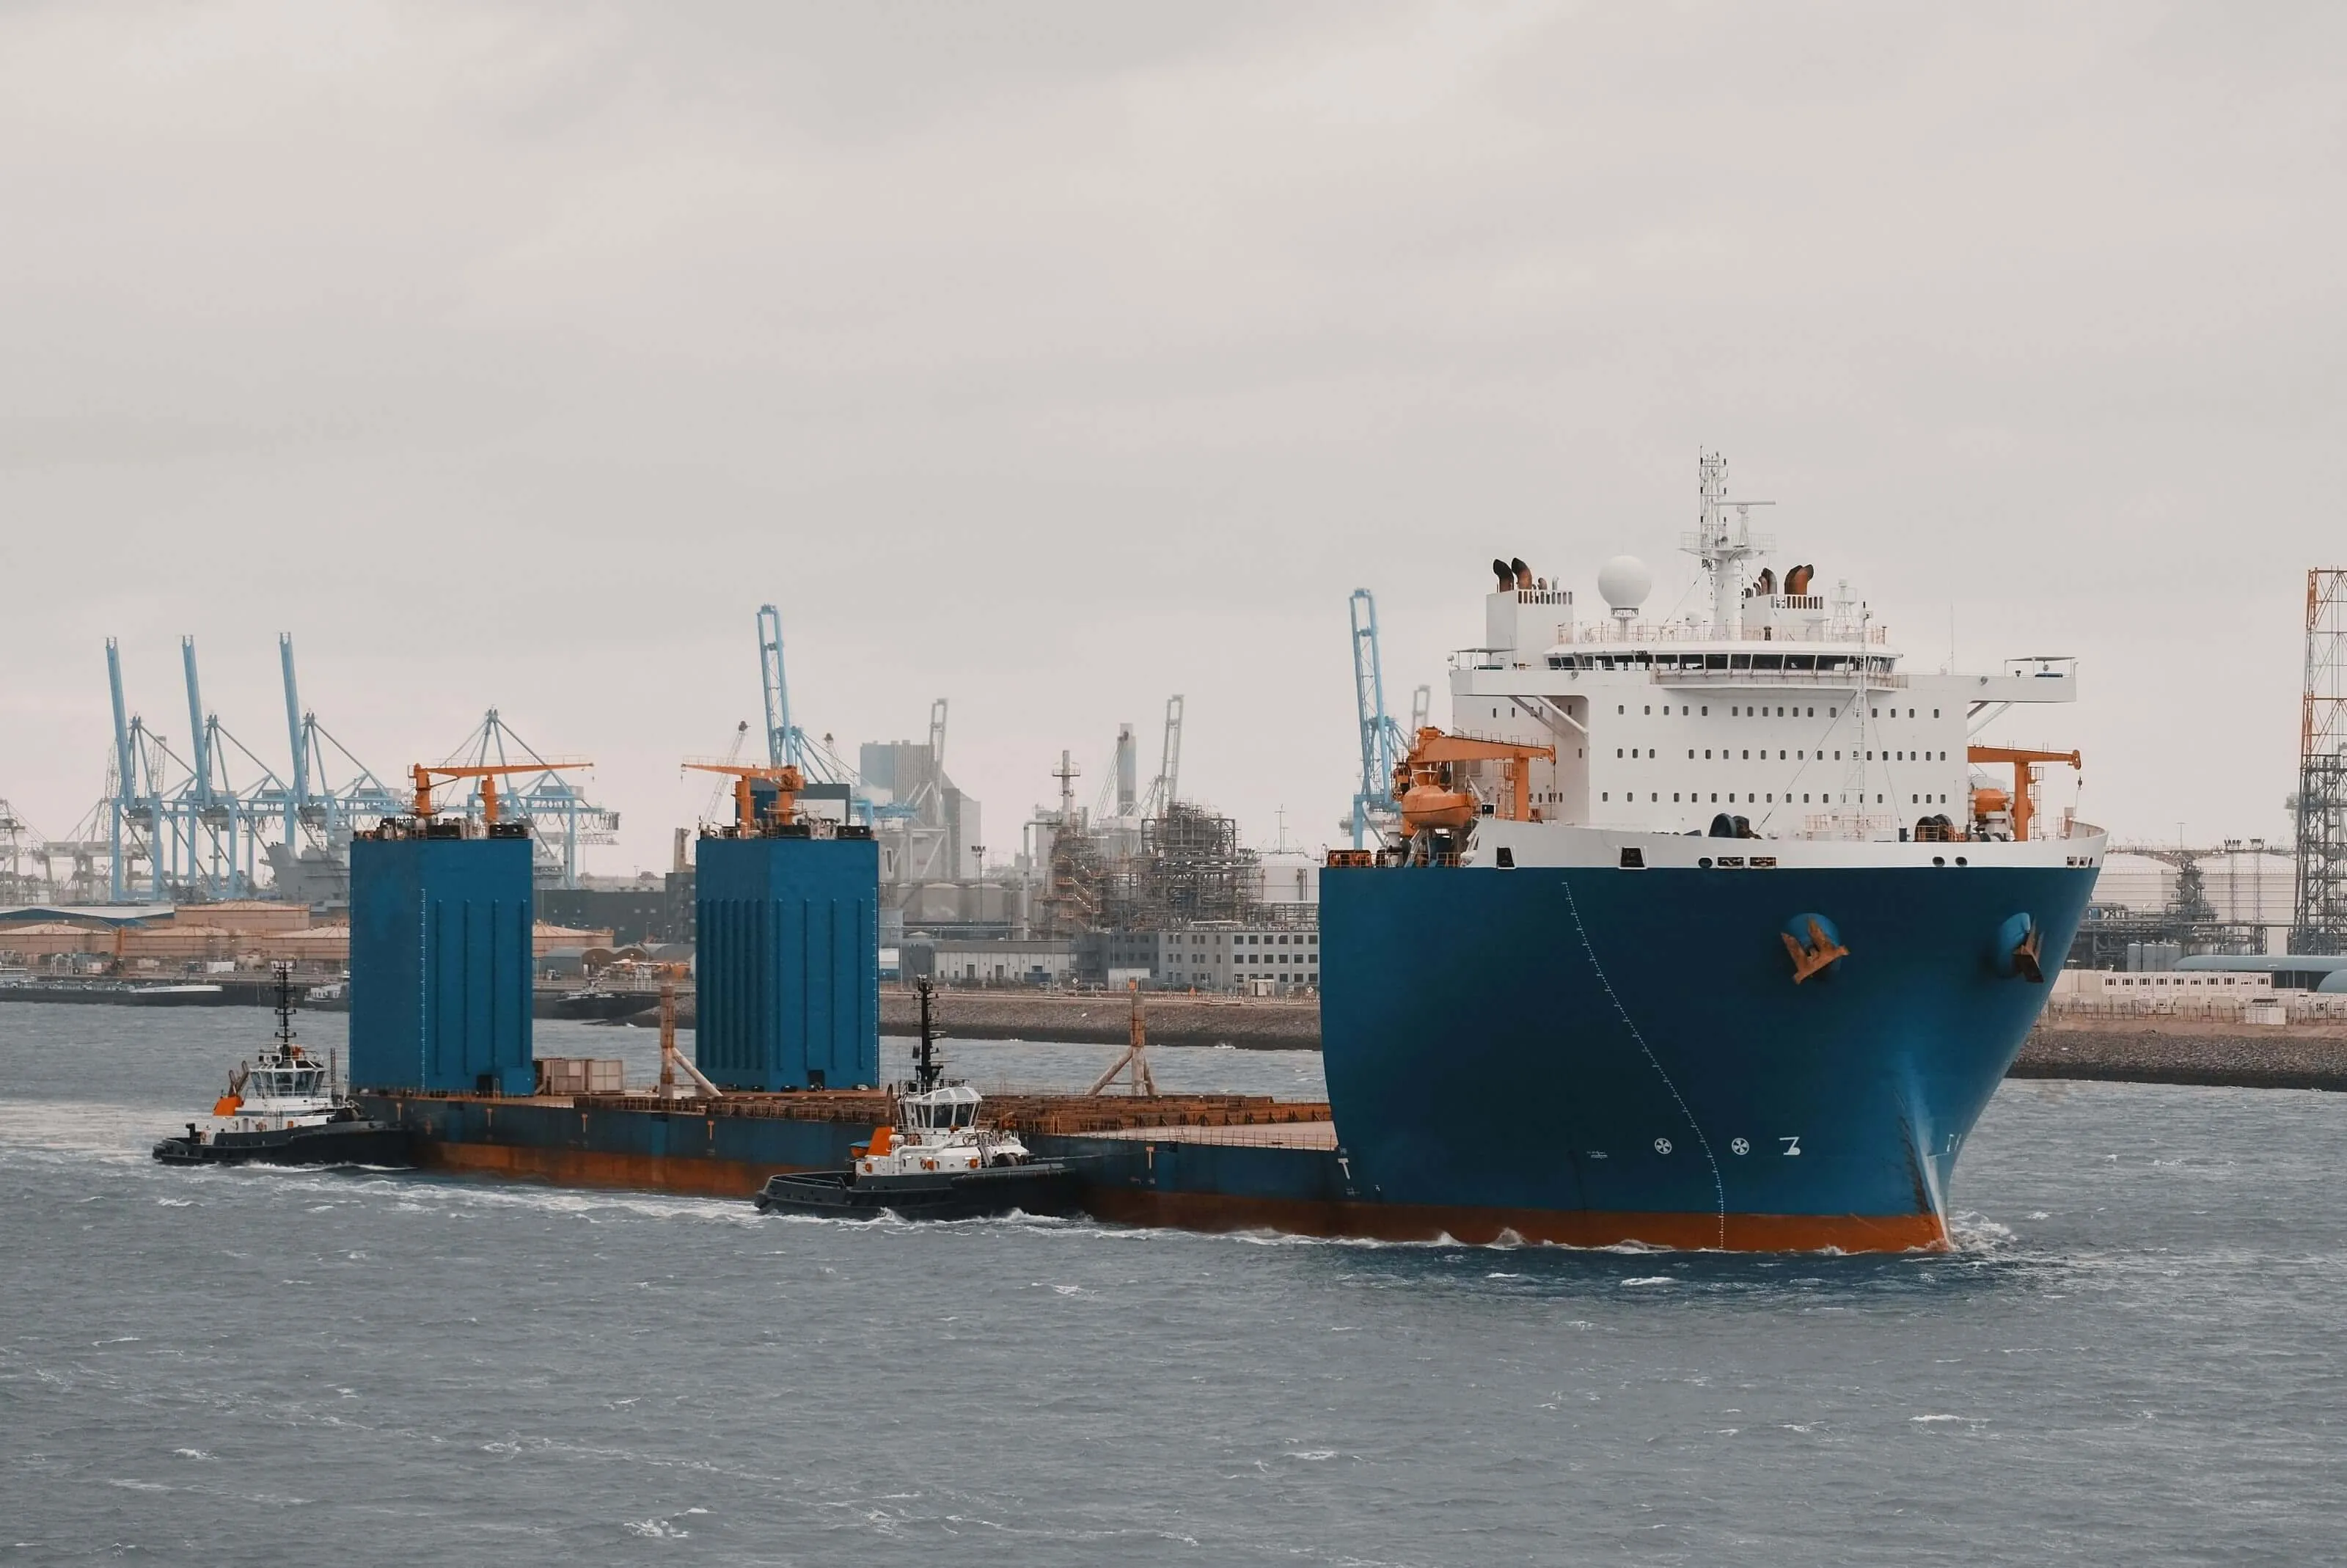
In all, 1,721 vessel days were required to supply and install the main components of the wind farm (OSS, monopiles, turbines, cables…) with turbines needing the most days overall (628 in total). All SOVs, CTVs and OSVs are not included in this analysis. The majority of the supply days were made up of general cargo vessels as they supplied all the turbine and foundation components. Fabrication of components was spread across Europe at eight locations while three logistics/marshalling ports were utilised in France meaning transiting was relatively local.
Challenge
Offshore wind farm capacity is expected to reach at least 270 GW by 2030 (excluding China), representing an increase of 900% in just eight years. With this level of growth, fabrication sites, which are mainly situated in Europe for now, will become saturated. Developers have already begun to look towards Asian yards for additional fabrication capacity which will lead to its own challenges including an increase in costs, fuel consumption, and the construction timeline of wind farms. With general cargo vessels transiting longer distances, this will also impact negatively on CO2 footprint of the wind farm during construction.
Meanwhile, turbine sizes will more than double from 8 GW on average to 16.6 GW in the coming years. This increase will add pressure to ports and vessel supply, particularly as cargo vessels large enough to accommodate larger turbines will be in high demand.
Supply chain analysis at such a granular level, as undertaken by Spinergie, allows wind farm developers and vessel managers to see how previous projects were managed, the number of vessels used and what work scopes took up the largest amount of time. This information provides time and money-saving opportunities across a wind farm project's full supply and installation scope.
Spinergie's market intelligence solution
Spinergie’s market intelligence solution SpinConstruction provides the key analysis required to build a comprehensive overview of the supply chain attached to an offshore wind farm project.
Data Layers
The Map incorporates a number of different layers which show different aspects of a wind farm project and offshore elements such as cables, ports and fabrication yards.
The Wind Farm layer depicts data from almost 900 global projects at various stages of development. Filters allow for search customisation with options including, but not limited to fixed/floating, foundation type and turbine model as well as location and project-based filters.
%2001.%20wind%20farm%20map%20.webp)
The Turbine & Substation layer provides an overview of turbines at a wind farm which can be analysed at a glance by the color code which indicates status. Additionally, it is possible to see more in-depth data on each turbine or substation via the map page or by linking to the turbine
%2002.%20wind%20farm%20map%202.webp)
The Cables layer maps out cable locations relative to wind farm projects. As with each data point within the Map it is possible to see additional data regarding each cable both on the map and in its specific Fact Page.
The Fact Page provides scheduling information on vessels involved in the installation, as well as further analysis of vessel days at the infrastructure and a database of the latest activity
%2003.%20wind%20farm%203.webp)
The Port/Yards layer shows different ports, shipyards and yard infrastructures, with a dedicated focus on the offshore wind industry (including marshalling construction ports, O&M operating bases and wind components facilities). Additionally, each port has a dedicated page providing detailed metrics such as vessel activities and schedules.
%2004.%20Ports%201.webp)
%2005.%20Ports%202.webp)
Historical Positioning
The Historical Positioning of any vessel can be accessed through the Map or through the vessel Fact Page. It gives detailed point-by-point information about a vessel’s activity and can be customised via the legend to display the required information.
In the analysis of the wind farm analysts used the Reported Draft layer to show if the vessel was carrying cargo or not during its trips back and forth from the fabrication port to the logistics base. The darker the arrows, the higher the draft. It is possible to view additional information at each point including activity status, transit speed and weather conditions at the vessel location.

Result
With a high number of vessels utilized throughout the course of a project, from initial transport to installation and ongoing O&M activity, it is key that developers and vessel managers understand the pressures this places on the fleet and the relation of vessel time to the critical path of a project.
Spinergie’s wind supply chain analysis allows vessel managers and wind farm developers to see vessel timings in previous projects and plan accordingly. Forecasting provides an overview of future activity that can give insight into where there may be potential supply bottlenecks and vessel deficits.
Contact Spinergie today for a demo on how SpinConstruction’s analytics can help you track and monitor ongoing wind farm operations and uncover optimization opportunities for your general cargo fleet.
Our team will show you exactly how we can adapt the solution to your needs.


.webp)

